09/14/2025.
I'd like to revisit my last post, Calendar Sticks and Lunisolar Calendars, where I looked at how the moon's yearly cycle influences how the Major Standstill was perceived. I'm not particularly impressed with the animation I did at the end, and want to try to explain what the Indigenous Peoples of the Hopewell Culture saw a little better.
I'm also going to do a bit of explaining of what's going on behind the scenes that often makes the actual dates and moonrise locations seem pretty random.
Introduction.
This graph shows the relevant boreal (northern) lunistice moonrises around the 1950 Major Standstill. Let me walk you through it.
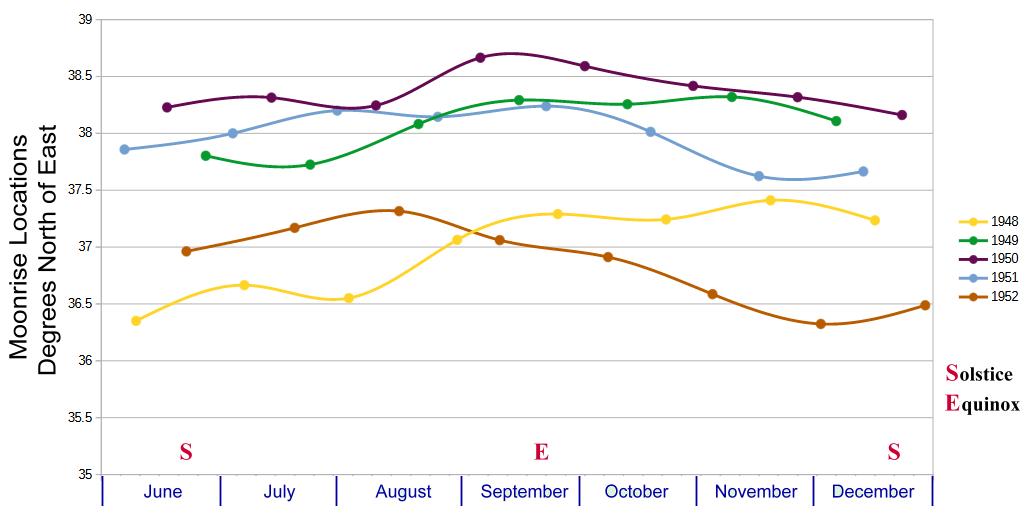
What it shows is the moonrise positions of the boreal lunistice moonrises from June through December for five separate years: the year containing the absolute northernmost rise and two years on either side of it. I show only June through December because, as we learned last time, the moonrises from January through July occur during the day and are therefore pretty much invisible at the horizon.
Astronomers use something called "azimuth" to measure where a moonrise is; that is the number of degrees from due north. To talk about moonrises, I prefer to talk about degrees north or south of due east. Then, while facing north, I can just extend my right arm to my side, and sweep it north and south to cover all the moonrises.
It's actually the solstices (summer and winter) that determine night-time moonrises, so I have marked each of them with a big red "S". In between is the fall equinox (important for a different reason), marked with a big red "E".
Let's look at the deep purple line for 1950, the main year of the Major Standstill. We see it peaks about about 38.5° near the fall equinox, between about 38° at each of the solstices. We also see that the line wobbles (in fact, all the line wobble). I'll discuss that later.
When we look at the full lines, we can see how the approach and retreat from the Major Standstill. You can see the yellow 1948 line centered at abou 37°. The next year, the green 1949 line gets farther north. Then we get the peak year, and the retreat through the 1951 light blue line followed by the brown 1952 line under full retreat towards the Minor Standstill.
Twin Lunistices.
Regarding the wobble, there are a number of things that contribute to that. Once of them is something I call Twin Lunistices. While the peak of the moon's orbit is a regularly scheduled event, it's not necessarily in sync with when it is time for the moon to rise (where in its orbit the moon is).
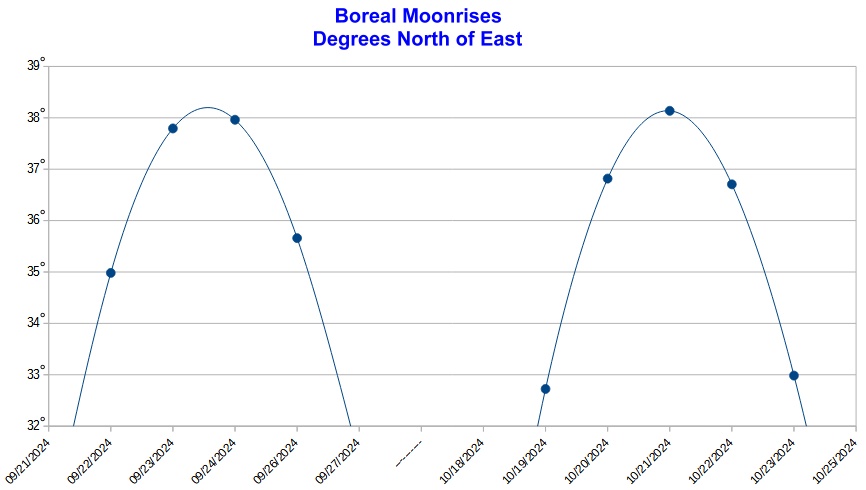
On the left you can see a "twin lunistice" while on the right is a lunistice that is timed to nearly hit the peak.
The Nutation.
Going back to the original picture, you can see the peak in September, near the equinox. But there are also rather obvious bulges in November of 1948 and December of 1952. These are caused but a nutation (wobble) in the rotation of the Earth that have a period of 177.84 days. The effect of the nutation is to pull the lunistice moonrise one way twice a year, and push the lunistice moonrise the other way twice a year.
Let me show you how those work.
You will notice that 177.84 days is just a bit less than half a year (182.62 days). That means that, from year to year, they travel around the calendar. During the year of a Major Standstill, these nutation extrema push the boreal lunistices north at the equinoxes and pull them south at the solstices. This tries to depict that:
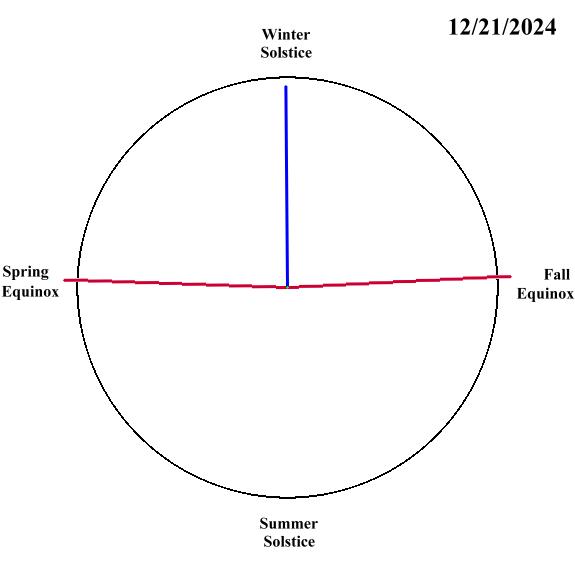
It shows the actual calendar position of the maximum "pull" (blue line) on December 21, 2024. It also shows the calendar position of the preceeding "push" near the fall equinox of 2024, and the following "push" near the spring equinox of 2025 (the red lines). Notice that the red lines do not make a straight line, since they are short of a half year by a few days.
In 177.84 days, the corresponding picture looks like this:
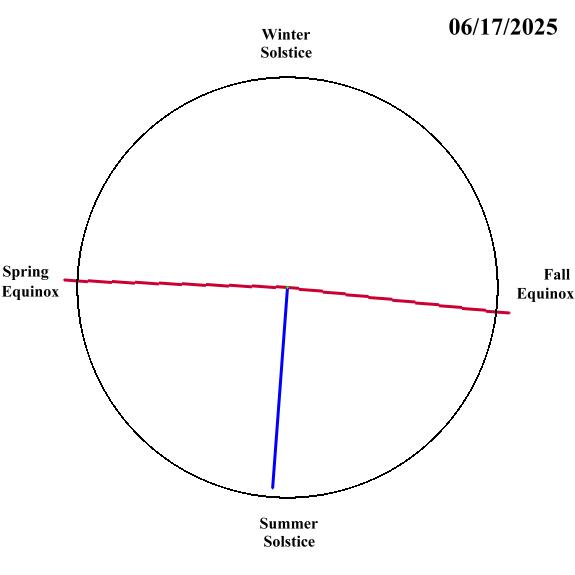
I hope that you can see that the blue line has moved 177.84 days, to June 17, 2025. The spring solstice red line is the same one we saw before (but now it is the "preceeding" "push") and now the red line on the right (the "following" "push") falls obviously before the fall solstice.
Here is an animation that follows this 177.84 day nutation "push/pull" from a bit before the Major Standstill in 2006 (2003) through and a bit beyond the Major Standstill in 2024 (2027). I have given the background for the Major Standstills in 2006 and 2024 a slightly pink tint, and the background for the Minor Standstill in 2015 a slightly blue tint.
See if you notice anything as you play it. In general, you want to keep your eye on the red lines to see how they progress.
What I hope you notice is that, due to the special nature of 177.84 days, the "push" (red lines) align with the equinoxes during the Major Standstill and the solstices during the Minor Standstill. And don't forget, during the Minor Standstill "pull" at the equinoxes, that means that the northernmost lunistice is farther south than it would otherwise be. Both the Major and Minor Standstills are a bit more extreme than they otherwise would be. Thus, the effect of this nutation is to widen the sweep of the northernmost lunistice moonrises by a full degree between the Major and Minor Standstills
100 Years of Major Standstills.
Okay. Let's return to the very first picture and show similar pictures for a bunch of Major Standstills. Here's the first one again.
And now the next one, 1969.
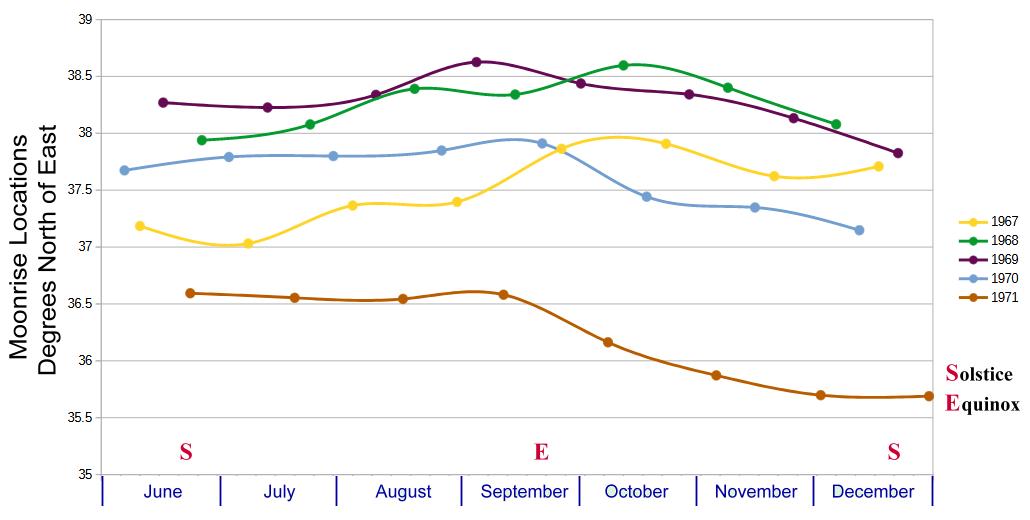
The first thing you should notice is we have the same lines again, in about the same places, and the moonrise points are on the same days as they were before. That's the operation of the Metonic Cycle. 19 years is close enough to 18.6 years that we get two similar Major Standstills in a row. Yes, notice that the extreme 1967 yellow line has moved. That's because, since it's trying to move into the top slot. It's closer to the 18.6 year period than the 19 year period constrained by the seasons.
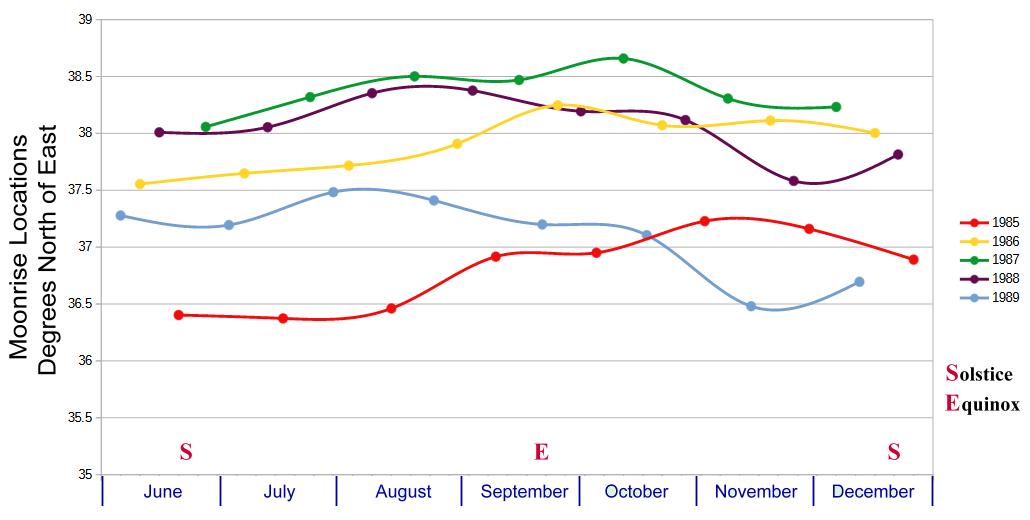
By 1987, the green line, and its set of Metonic Dates has moved into the top spot. And you'll notice that 1987 is only 18 years away from 1969. Just as for a lunisolar calendar, you have to intersperse months to keep the seasons on track, here, Nature has some Standstill intervals of 18 years and some of 19 years to keep the moon and tandstills in line with the moon's yearly cycle.
We also have the brown line from 1971 fall off the chart (it still repeats its dates in 1990, but is too far from the Standstill to show up here.)
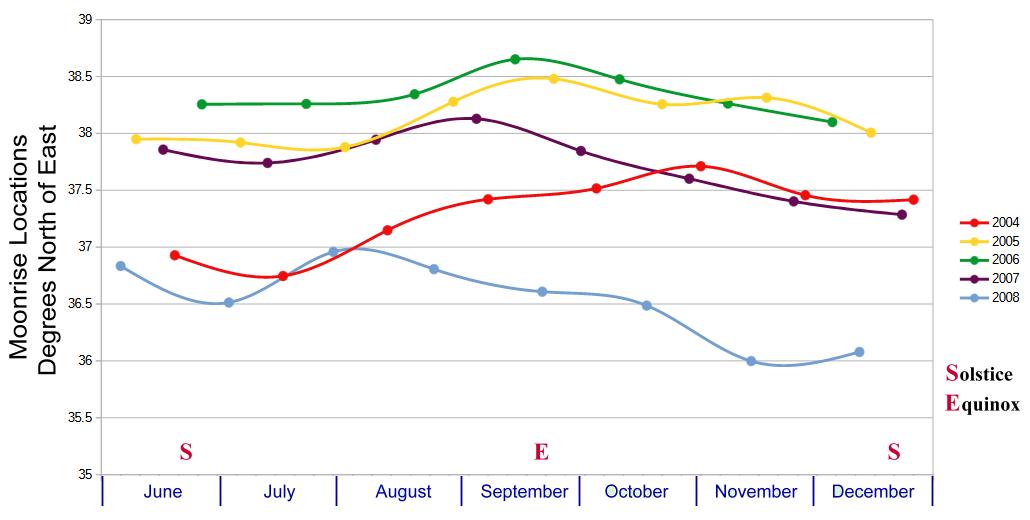
Here in 2006 we get a repeat of the green line with another 19-year gap. But the yellow line from 1948 is almost ready to lap.
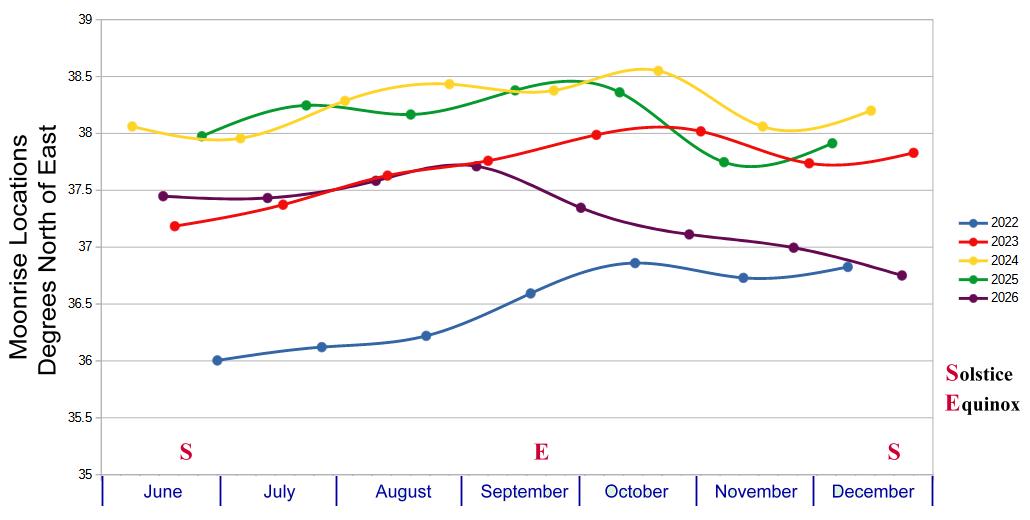
And in 2024, with an 18-year gap again, the green and yellow lines swap.
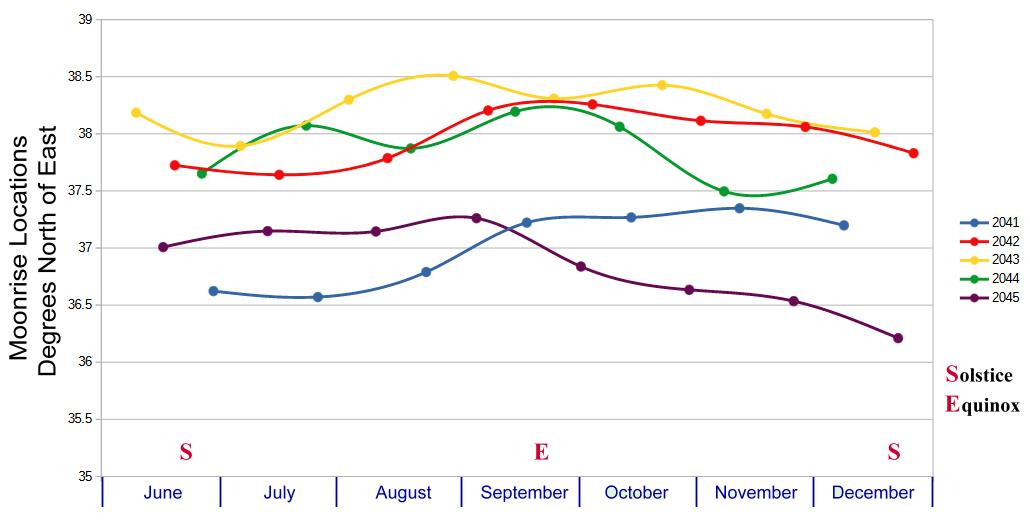
Finally, in 2043, with another 19-year gap, we get a full repeat in the top 5 Standstill years.
I hope you can see the pattern. If not, look at it for a while and play with it in your head. After all, this is what the Indigenous Peoples did, and they did not have a computer and fancy graphs to assist them.
Lines of lunistice moonrises repeat every 19 years. But because the Standstills are driven by an 18.6 year cycle, lines that get too "old" fall off the top while new young whippersnappers arrive from before the Standstill and then slowly move up in the world before they, too, age out. (Ain't that life?)
The End of This Cycle.
I hope this has given you a better feel for what is going on here. Just as with lunisolar calendars, interpolations occur to keep inherently non-integer cycles in sync with an inherently integer year. Because of the Metonic Cycle, the dates for each line of moonrises stays essentially the same, which, I suppose, would give the Indigenous Peoples a handle, with their calendar sticks, on noticing the repeating pattern. But it also takes good record-keeping and paying attention to the world about them. And that is what they did.