01/20/2025.
I've mentioned before that the actual apex of the moon's 18.6 year cycle occurs on January 26, 2025. By "apex", I mean that the axial tilt of the earth and the tilt of the plane of the moon's orbit are as close together as possible. This is what drives the Major Standstill. I've also said that there's really nothing to see that day because the timing of this apex is generally unrelated to the lunistices.
However, this cycle, it does just happen to occur on an austral (southern lunistice). That is, the moon will rise at a southernmost risepoint. And there is a bit to see (though it's not spectacular).
Also, you might be curious about how I know about January 26. You'll not find it anywhere by googling (as far as I can tell).
Here's the moonrise line-up with a leg of the Octagon.
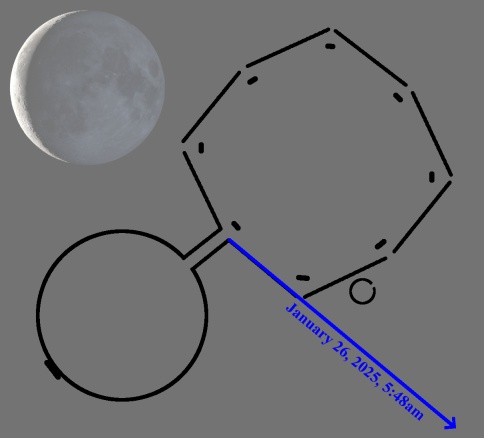
The moon will rise at about 5:48 in the morning (bring your coffee!). Because austral lunistices around the winter solstice occur near the new moon, the moon will be lit only about 10%. But since sunrise isn't until around 7:43, it should be pretty visible.
Unsurprisingly, there are some trees in the way. This is a view from the end of the mound.
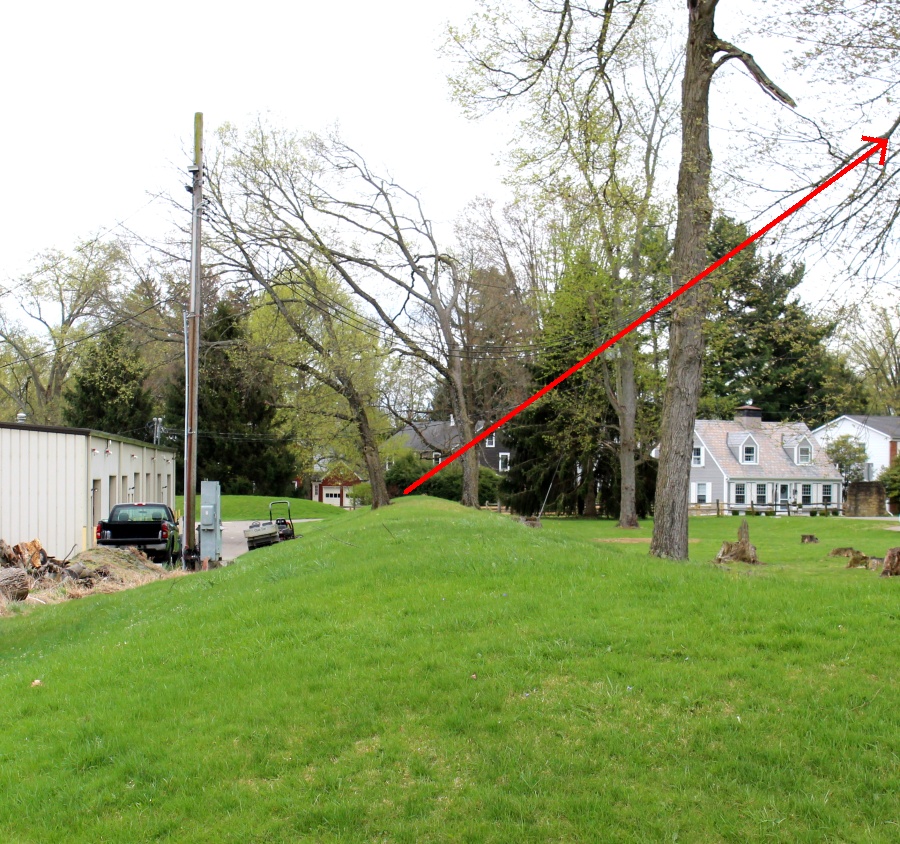
I've marked the path the rising moon will take. It will take the moon about an hour to show itself past all the evergreens, but since the sun will not have risen yet, it should be nicely visible.
Okay. From here on is nothing but extreme nerditude. Feel free to abstain.
So, here's how I know about January 26: I have a dataset of every moonrise from the year 0 through the year 2043. I grabbed the NOVAS software package from the Naval Observatory (and ) ephemerides from the Jet Propulsion Laboratory and wrote my own interface to find moonrises.
From all the moonrises, it is pretty easy to pull out the northern lunistice moonrises, of which there are over 27,000 of them. This picture shows about 2 cycles worth.
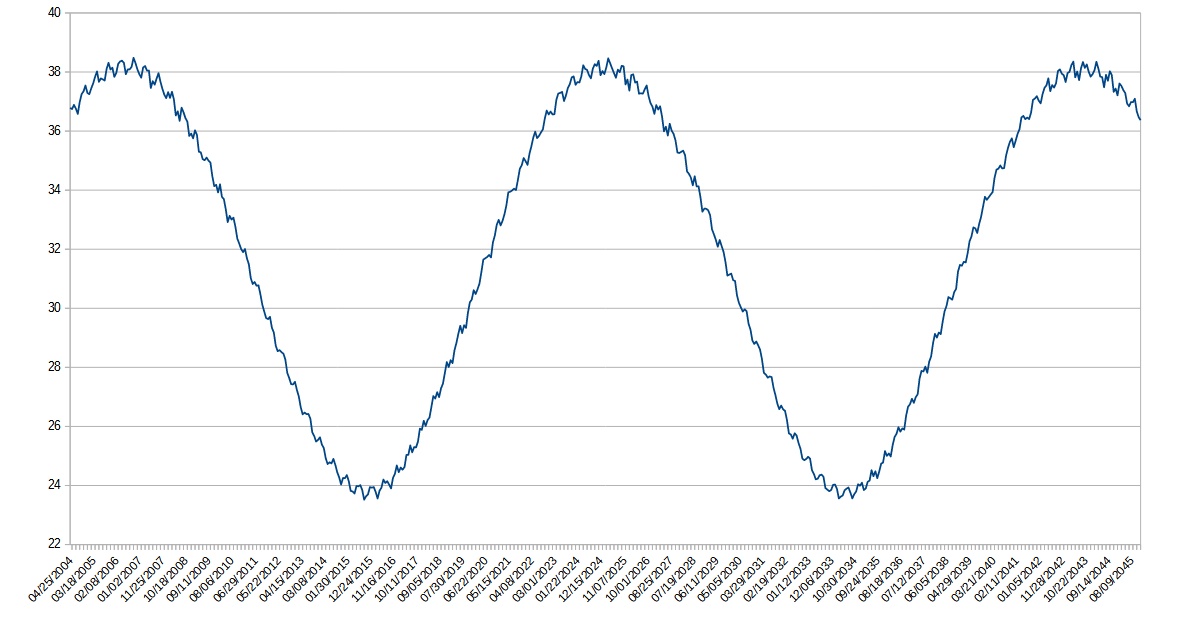
Note that I often will not use the azimuth for the moonrises (as astronomers do) but instead the number of degrees north and south of due east. That is because, in my experience, people often look north and use their arms to point out moonrise locations to their right.
You can see the peak around 2024-2025 for the current Major Standstill, and the trough of the Minor Standstill around 2015-2016.
But you can see that there is more going on.
When one is looking for cycles in data, one cool trick is to try to do a least squares fit to sines and cosines. The mathematics look something like this, where you try to minimize that expression.
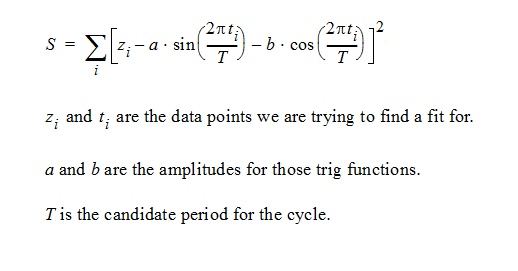
For those sines and cosine, "a" and "b" are their amplitudes, and "T" is the period of the cycle you are looking for. The minimization is linear in any amplitude so the amplitudes are easy to extract. Less so with the period.
Interestingly (to me), the results are similar to looking for elementary particles, such as is done at the CERN particle accelerator, or FermiLab outside of Chicago. When the energy of the colliding particles is just right, you see a resonance in the data.
This is the graph showing the value of "S" for a bunch of different periods.
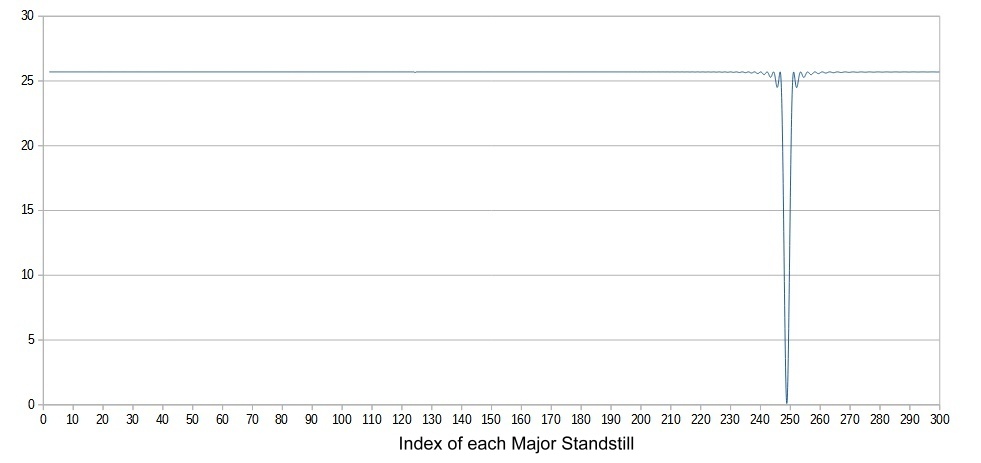
When you test a wrong period, all of the differences in the "S" equation are large and add up to a lot. But the closer you are to a cycle in the data, the smaller all the difference are, and this is what you see.
There is one data point (zi) for each northernmost lunistice moonrise (each ti), so that index i serves as a pseudo-time. But that pseudo-time is approximately 27.322 days. That huge dip is the match for just under 249 lunistice cycles, which is the 18.6 year cycle. However, from the data, I can determine its value more accurately than just one decimal point.
What you can do after that is subtract off from your data that particular resonance, see what's left, and repeat the process. And you use a trig identity to express them all as cosines with a phase. This gives one a pretty good view of what it going on and how the cycles might be related.
Once you think you knows what is going on, you can set some conditions and do them all at once. Many of you will recognize that this is like doing Fourier transformations for specific frequencies. Anyways, this is what results, showing the top 4 cycles.
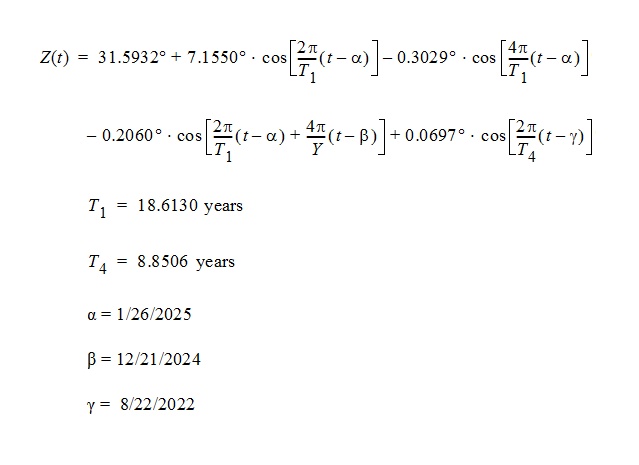
Let me explain them:
The 31.5932° is just the average of all the northern lunistice moonrise positions. The next term shows the 18.6 year Standstill (that's the T1). The amplitude is 7.15°, which shows the lunistice moonrises swinging north that far for a Major Standstill and south that far for a Minor Standstill. The phase, α, tells you when the value is at its maximum (the apex of the Major Standstill). As you can see, for the current cycle that is 1/26/2025 and so now you know where I got that date from.
You may notice that the next term uses that same α. I'll explain that next.
The period for this term is 9.3 years, half the 18.6 (that's the 4 in the numerator instead of a 2). But notice that it uses the same α, and has a negative sign for its amplitude of 0.3°. What this does is move all of the moonrises slightly south. This is why the Octagon is not perfectly symmetric—the southern moonrises go a little bit more south than the northern ones go north.
The picture tries to explain what is going on.
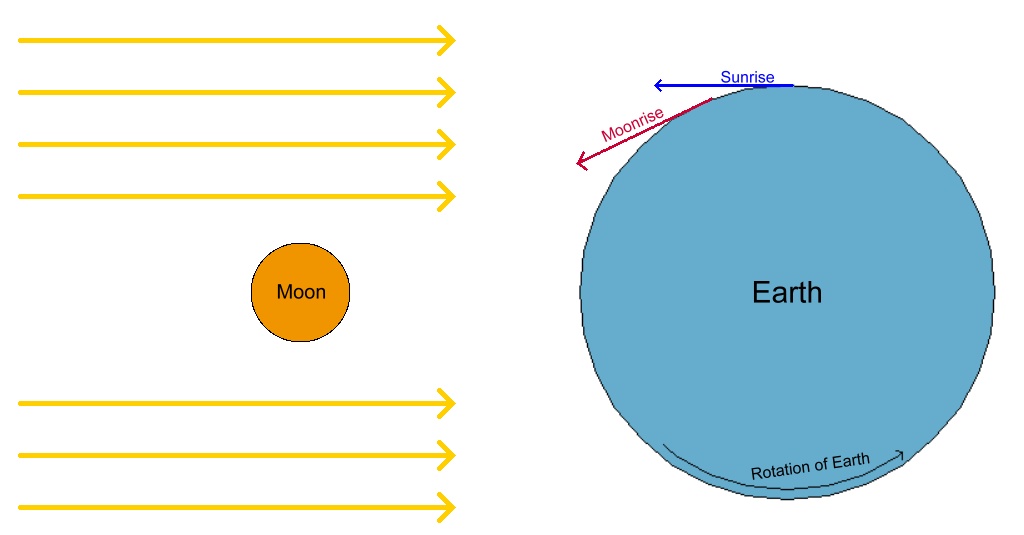
If the moon were infinitely far away, northernmost and southernmost moonrises would be equally north and south. However, the moon is (relatively) close to the earth. As the earth rotates, eventually the moon comes into view (that's a moonrise). But with the moon close by, the earth has to rotate just a little bit longer to get to the moonrise. This makes the moonrise a little bit later that it would otherwise be, and it also makes the moonrise be a little bit more southerly.
The picture also addresses the last (5th) term, which has an amplitude of 0.07°. The 8.85 year period has to do with the eccentricity (oval shape) of the moon's orbit. The closeness of the moon changes, and that closeness varies with an 8.85 year period. But that closeness follows the same rule as the third term. The phase, γ, is when the lunistice and apigee (moon farthest from the sun) align.
Now let me address the 4th term, which you will notice is the most complicated. It accounts for (much of) those extra little bumps and displays why, during Standstills, the northernmost lunistice moonrises occur at the equinoxes, and dip at the solstices between.
This is related to a nutation (wobble) in the rotation of the earth. It is driven by the changing gravitation force on the earth due to the interaction of the motions of the 18.6 year lunar cycle of the moon and the solstices. That is why there are two different periods inside the cosine. T1 is again the 18.6 year cycle, and Y is the length of a year. These terms combine to create a 177.84 day wobble (slightly less than half a year). T1, as before, has the phase α, but there is another phase, β, that aligns the wobble to the equinox at the time of a Standstill. You can also see that the amplitude, 0.2°, is nearly as large as the 0.3° associated with the nearness of the moon.
As you can see from the value of β, this aligns on the solstice. The negative sign on the cosine shows that it's not so much that the equinox moonrises are more northernly, but the solstice ones are less so. In this picture, you can see this effect as the Standstill approached.
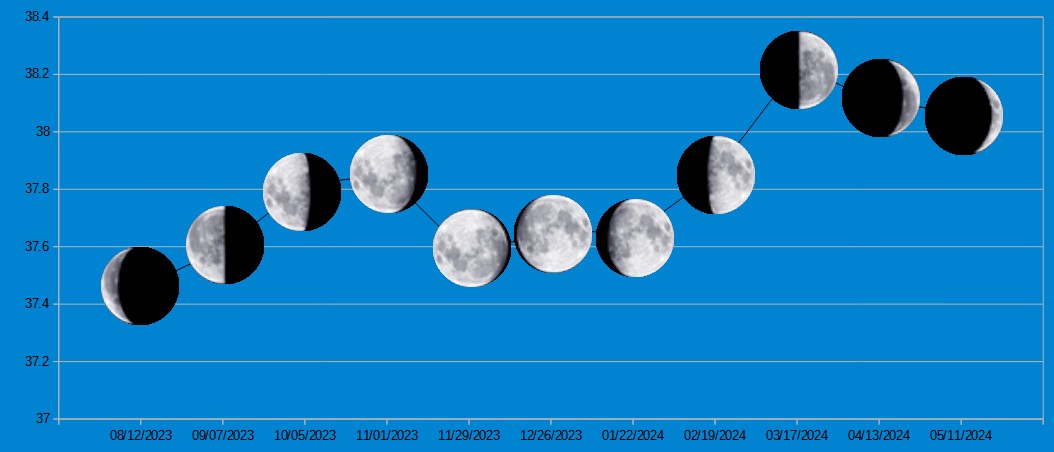
The angular difference between the highest northernmost moonrise during the equinox and the lowest during the solstice averages about 0.57°, more than the width of the moon, and most likely was quite visible to the Indigenous Peoples of the Hopewell Culture.
To wrap up, there are plenty other, less visible cycles going on that tend to give the appearance of randoms jogs in the moonrises. Also, the way I analyzed the data using pseudo-time means I miss some short-term cycles (like the tidal cycle). But I think the methodology gives us a decent overview of what is going on for the major aspects of the moonrises at the Standstills and the design of the Octagon.
Reference:
Various Aspects of Numerical Determination of Nutation Constants. I. Improvement of Rigid-Earth Nutation", by Zhu, S. Y., Groten, E. Astron. J. (1989) 98, 1104-1111, 1108.